Storm Surge Monitoring
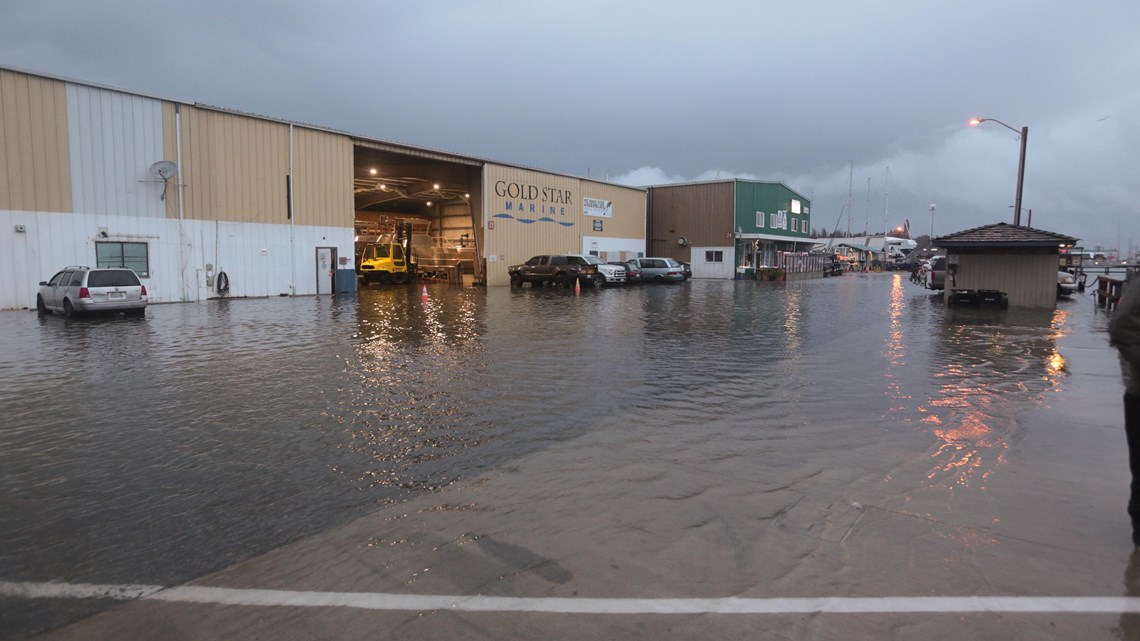
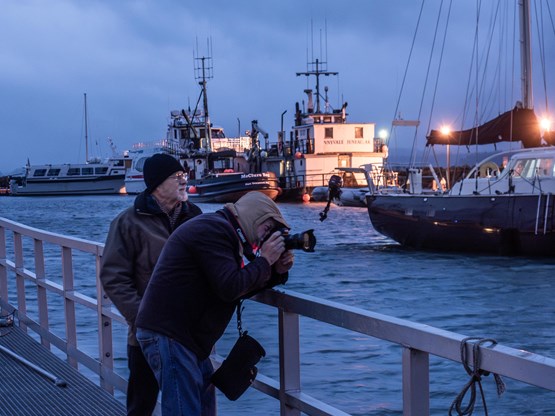
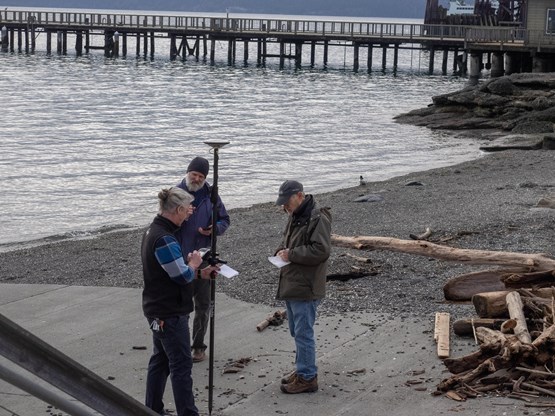
Coastal hazard professionals and community volunteers have identified data gaps in existing king tide observations in Washington State associated with the degree to which storm surge and wave runup contribute to coastal flooding. In effort to address these data gaps, the Jefferson MRC is monitoring a study site near the NW Maritime Center in Port Townsend to assess total water levels. Monitoring total water levels captures the sum of parameters that contribute to coastal flooding events (i.e., tidal elevation, storm surge, wind direction, wind speed, fetch, and wave runup) that are not currently assessed together in forecasts. The Jefferson MRC is also developing a protocol that can be adopted for other locations across the Salish Sea so that other communities can better understand their own coastal flood risks and make more informed decisions at the local level. This involves collecting repeat photos during high storm surge and wave runup events at the same location, using fixed features in photos to provide reference against which the elevation of total water level during these events can be estimated, and coupling these observations with ancillary data on other parameters that contribute to coastal flooding. The overall goal of this project is to improve our understanding of the combination of variables that contribute to coastal flooding events in order to make better informed decisions about site-specific flood risks.
Additional Resources
- Overview of the Storm Surge Monitoring Project (5-minute Video)
Instructions to access Port Townsend storm surge reports from NWStraits SoundIQ (in 4 easy steps)
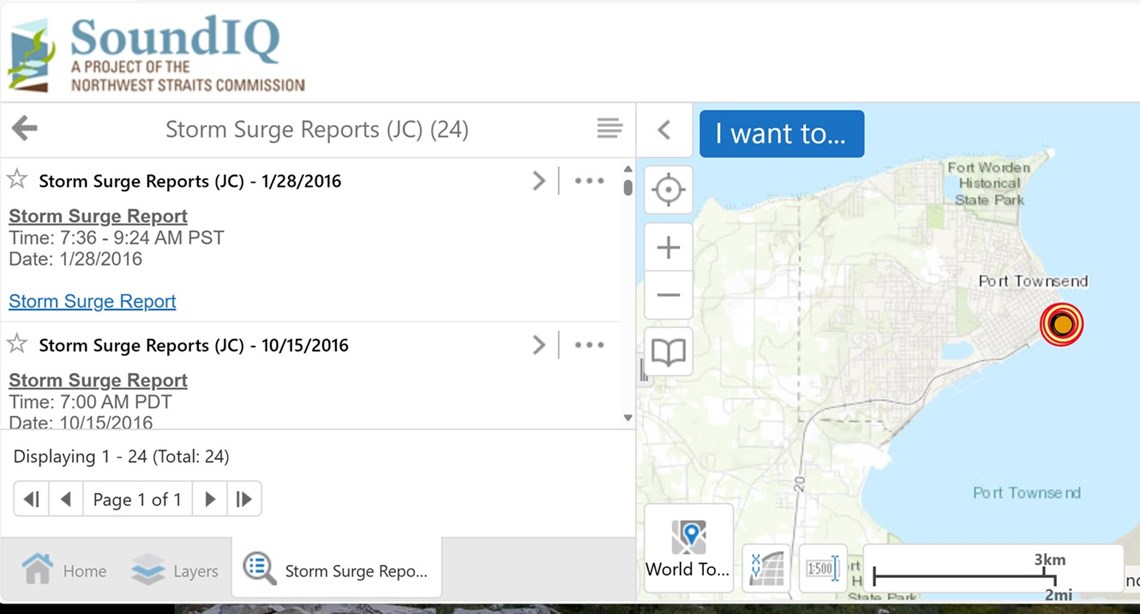
1. Open SoundIQ and zoom into Port Townsend
Select Layers on the lower left, turn off layers “Plants and Animals” and “Management Areas” to reduce clutter, and select and expand “Shoreline Data” and select “Storm Surge Reports (JC)”.
This will open a new tab with all the current storm surge reports (see screenshot below).
2. The detailed reports can be selected from this list.
The “>” symbol will expand to show additional information about the event.
SoundIQ can also access an index of the reports. The index is a spreadsheet with a link to the detailed report. The index can be used to sort the reports on any parameter (tide level, total water level, storm surge, wind speed, etc.).

3. To select the index, use the menu button and select switch to table view (see screen shot to the right).
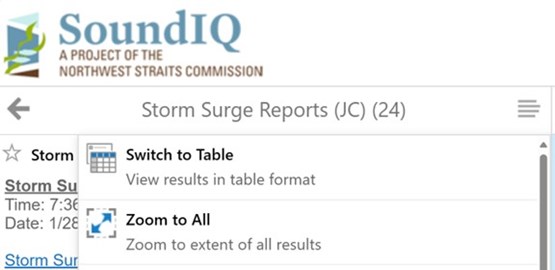
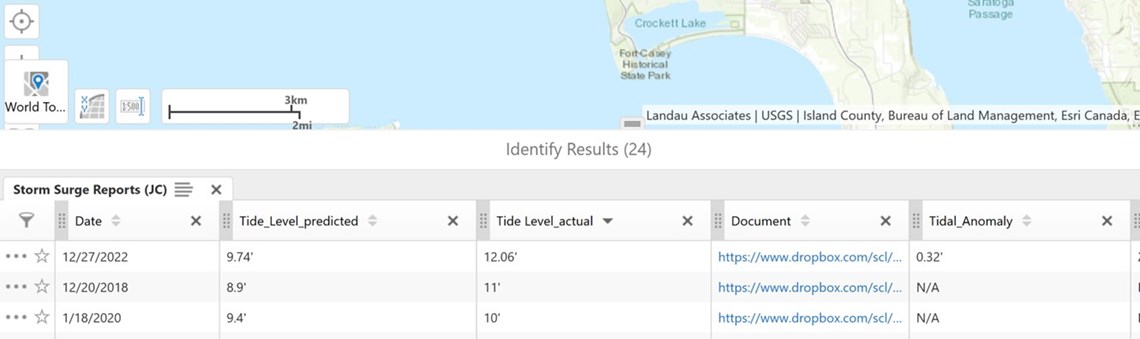
4. To get the detailed report for the highest tide, pull the Document column over to the Tide Level column and sort it from high to low (see screenshot to the right).
The highest water level we monitored at Port Townsend was 12 feet on December 27, 2022. Note the hyperlink in the document column will bring up the detailed report with information about the atmospheric conditions that caused the storm surge, photos, and measurements of the wave runup at the Port Townsend boat ramp.